_sss.jpg)

Recently, we talked to a prospect that struggled with a gut feeling they couldn’t quite translate into hard-and-fast facts. They knew their supply chain was too complex, and the complexity level could be reduced. But they were unable to explain the details to the rest of the company. The issue persisted, as no one really knew how to fix it.
It’s not the first time we’ve heard this. At the intuitive level, most supply chain managers are aware of the hidden costs of complexity. But it’s difficult to quantify such costs, as they seem to be elusive by definition.
The good news is, that doesn’t have to be the case. Many companies can’t pinpoint these expenses due to the way in which they report on performance and costs. With that in mind, I’d like to discuss two simple reports that can help identify those hidden costs.
Identify the hidden performance impact of complexity
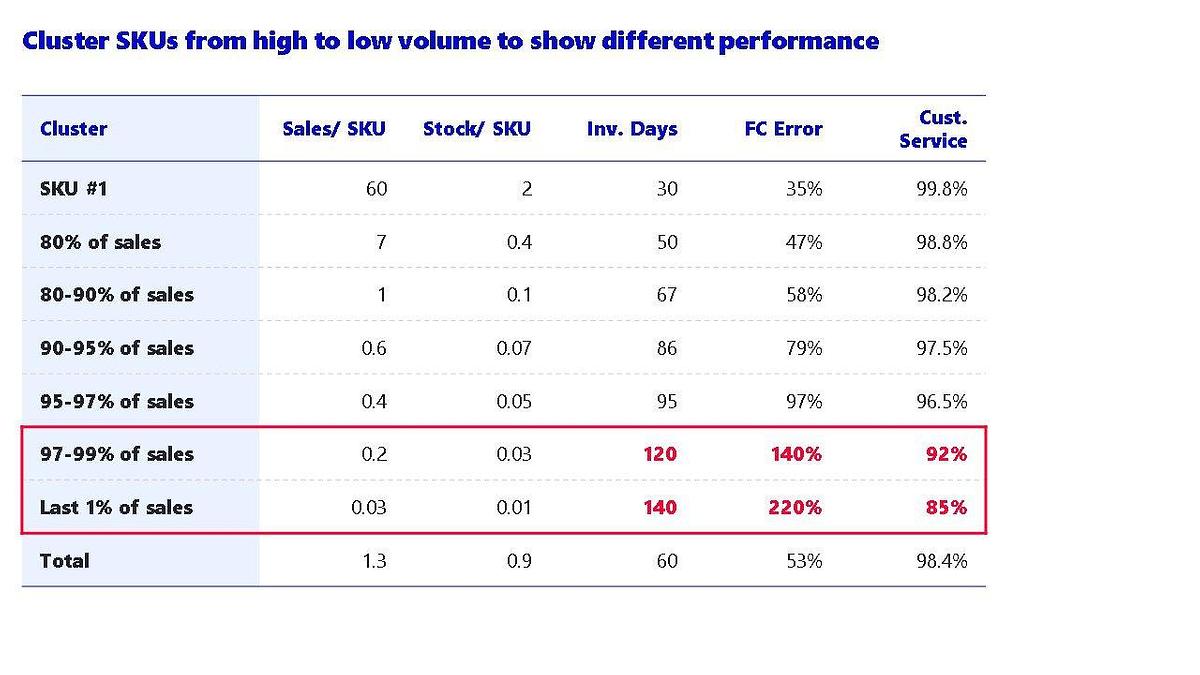
Virtually all supply chain departments report on stock turns, forecast errors, and customer service (or, OTIF). But they mostly do so at the aggregate level — or, they measure things per product line or business unit.
Here’s the problem with this approach. You may achieve a 95% score and think you’re doing great. That might be true at the overarching level, but you won’t be able to spot a common bottleneck: the myriad of small products that don’t perform well in terms of delivery and efficiency.
The solution is to distinguish between big and small products. Use segment performance across SKUs — clustering them by volume — to highlight the hidden performance impact of complexity. An example is shown in Table 1.
To see if you’re getting the most out of your assets, you might also have to include change over time and asset utilization per gross profit.
If you adopt this approach, you’ll likely find that small (or, long-tail) SKUs come with poor customer service while using more inventory space. Once you’ve identified this issue, it’s time to assess if you can provide the required service at reasonable supply chain costs.
Unearth the hidden costs
Usually, overhead costs are spread evenly across all SKUs based on revenues. The result: if SKUs have similar gross margins, they will be equally profitable.
But in practice, overhead costs are driven by the number of SKUs rather than overhead costs. When it comes to forecasting and inventory management, large and small SKUs often require a similar time investment. And given the above-described performance issues, you usually end up spending even more hours on the smaller SKUs.
To get a better picture of your margin per SKU, you should allocate costs evenly across all SKUs. For an illustrative example of the difference in allocation on margin per SKU, have a look at Table 2. As you can see, the smaller SKU is a lot less profitable after reallocating overhead costs.
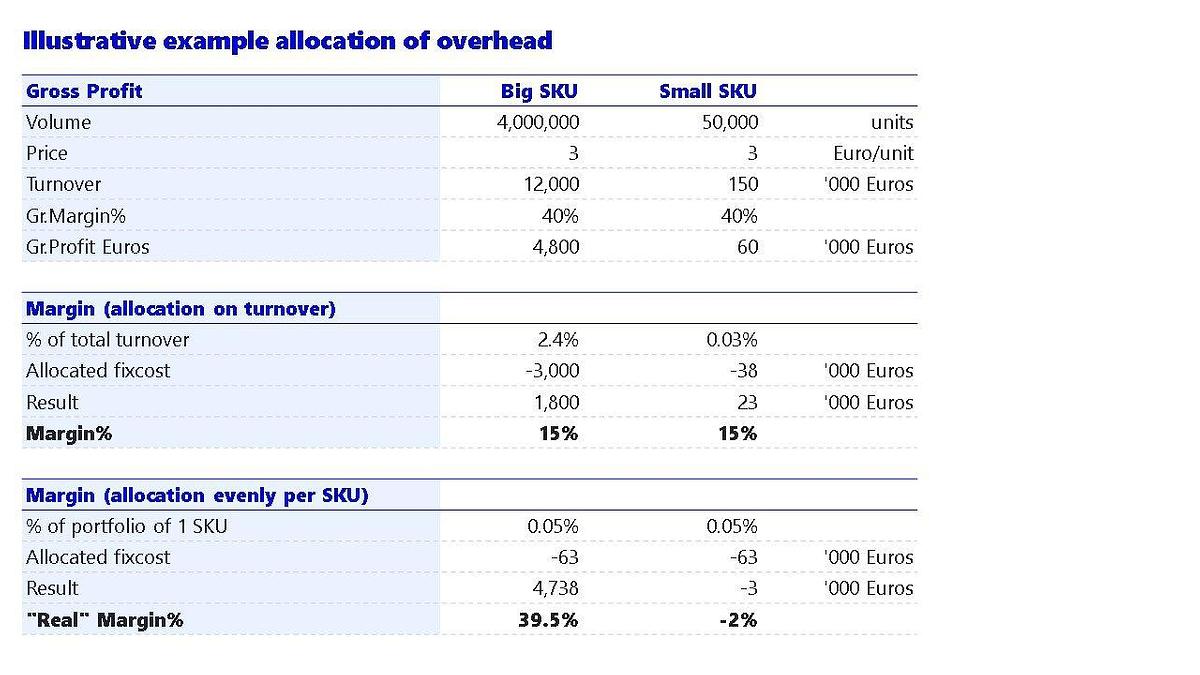
Revenue: 500k euros; fixed costs: 125k euros; SKUs: 2,000.
What’s next?
Now that you’ve identified your SKUs’ true cost to serve, you will want to ensure it’s better reflected in the margins of small SKUs. There are several ways to go about it:
1. Change the allocation of overhead costs: adjust processes to spend less time on low-volume SKUs, reducing overhead costs for them.
2. Improve the gross margin on low-volume SKUs: increase pricing or reduce sourcing costs, and the gross margin for low-volume SKUs could be improved, compensating for higher overhead costs.
3. Rationalize SKUs: merge several smaller SKUs into a larger one whose overhead costs support the same revenues.
Remove non-value adding products: if SKUs really don’t perform, you might want to remove them — though this is likely your last resort, as options 1-3 often bear fruit.