

In our previous blog, we described 3 types of drivers for recovery in aviation that affect current market dynamics, allowing some parties to better position themselves to pick up air travel demand than others. Now, let's use them to explain some observations. We'll discuss 3 topical examples!
Example 1: comparing hubs in London, Amsterdam, and Paris
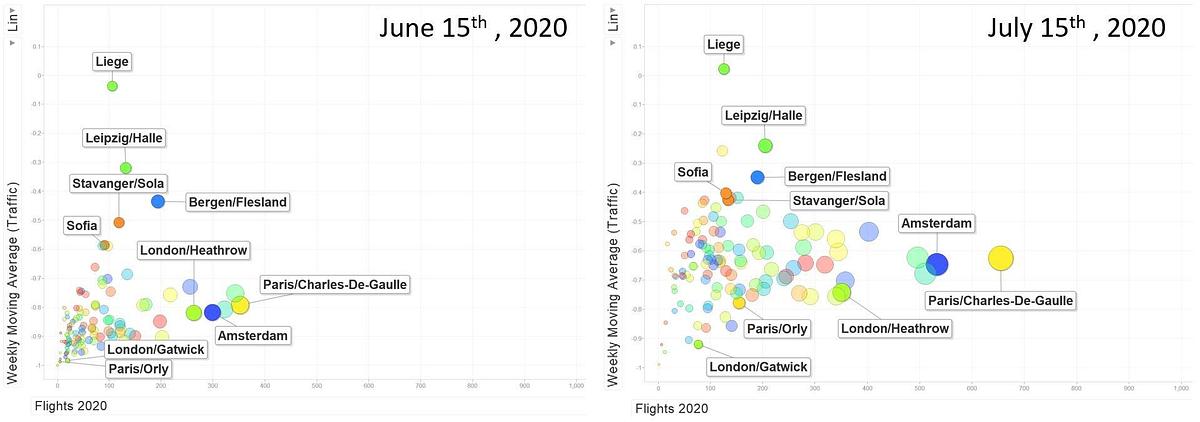
Several international travel bans have been lifted in mid-June. One month later, London Heathrow (LHR), which used to be one of the biggest hubs in Europe, lags behind compared to Amsterdam Schiphol (AMS) and Paris Charles De Gaulle (CDG) – in mid-July 2020, LHR activity recovered to -74% compared to the same day last year, whereas CDG and AMS recovered to -64% and -62%, respectively (see figure 1).
There are, of course, country-specific drivers. The UK imposed a 14-day self-quarantine rule and discouraged travel to the UK, while France only imposed a 14-day self-quarantine on passengers from outside the EU. The Netherlands didn't impose any travel restrictions.
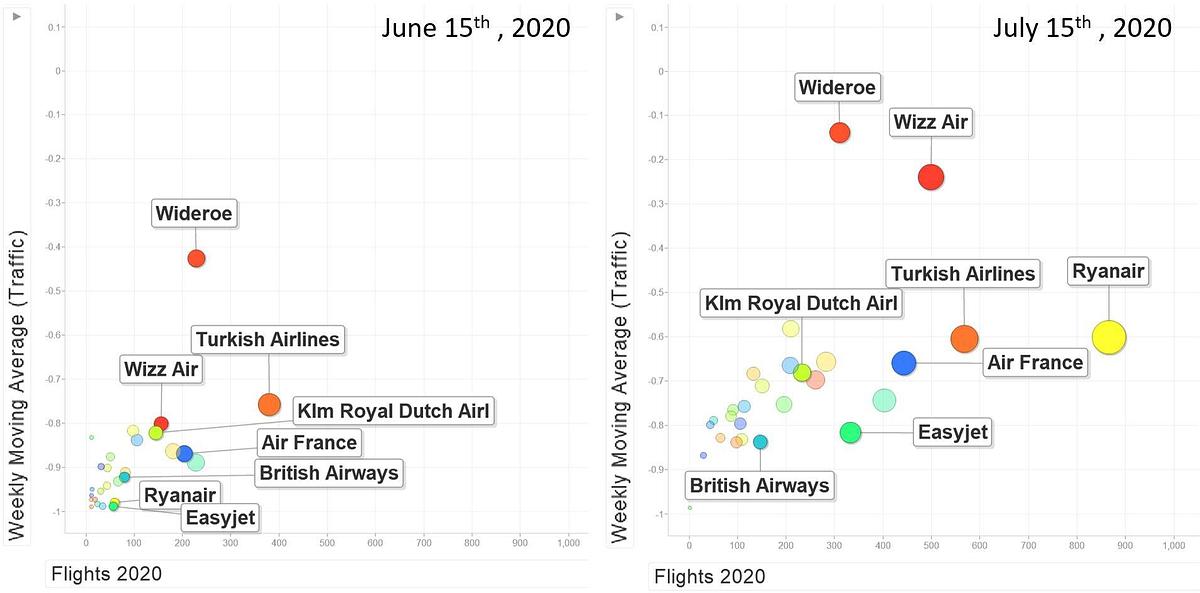
What about airport-specific drivers? Travel restrictions imposed by the UK government impacted activity at LHR as carriers were forced to downsize operations. In mid-June 2020, British Airways' flights had dropped by 92% compared to 2019, and EasyJet temporarily halted operations. AMS and CDG maintained a basic level of operations, mainly driven by their respective home carriers KLM (-81%) and Air France (-85%) (see figure 2).
Additionally, CDG benefits from the temporary closure of Paris Orly (ORY), picking up part of the traffic that would usually go through ORY. Incidentally, if the UK’s travel restrictions wouldn’t have been imposed, LHR might have benefitted from the closure of London Gatwick (LDG).
AMS, in turn, takes advantage of the fact that it was completely saturated pre-COVID-19, meaning it's well positioned to pick up additional air travel demand that would have been forced to travel through other regional airports if there were no crisis.
Moreover, the share of intercontinental flights at LHR is relatively high compared to CDG and AMS. This puts LHR at a disadvantage, as the recovery of long-haul travel is expected to take longer. OAG Schedule Data shows 39% ICA share for LHR vs. 31.5% for CDG and 18.5% for AMS in 2019.
Finally, we need to have a look at airline-specific drivers. How did the three airlines discussed recover from mid-June to mid-July 2020 compared to the same day last year?
• British Airways: from -92% to -83% of operations
• KLM: from -81% to -65% of operations
• Air France: from -85% to -67% of operations
Keep in mind that KLM and Air France received significant financial support from their respective governments, while British Airways was less fortunate in this regard.
Example 2: low-cost carriers are well positioned to pick up demand
Low-cost carriers are well positioned to pick up demand. They can quickly respond to market recovery, as it’s easy for them to move fleet around within their own EU point-to-point network. Wizz Air and Ryanair are great examples of this: compared to last year, operations were scaled from -80% to -24% and -99% to -60%, respectively — in just one month.
Another low-cost carrier, EasyJet, really lags behind: in terms of operations, it went from -99% in June to -82% in July compared to last year.
OAG Schedule Data shows that 50% of flights operated by EasyJet in 2019 were connected to UK destinations. For Ryanair, the figure was 34%, and for Wizzair, 24%. As a result, EasyJet has been impacted more significantly by the discouraging travel restrictions the UK government imposed.
Example 3: major crisis, limited effects (for some airports and airlines)
In mid-June, several airports and one airline were little affected by the crisis compared to their counterparts. Why was this the case? Well, Liege and Leipzig are regional airports that focus on air cargo demand, which spiked during the crisis due to the absence of long-haul PAX operations while there’s been a pressing need for medical supplies. Furthermore, Stavanger Airport, Bergen Airport, and airline Wideroe benefited from financial aid imposed by the Norwegian government to secure national connectivity.
Conclusion: the combination of factors is decisive
The examples show the following: the degree to which an airline or airport is positioned to recover from the crisis always results from a combination of the different drivers for recovery.
Curious how air travel demand is picking up again? Check out the Aviation Intelligence Dashboard and track the latest developments!
If you want to know more about the drivers for recovery, read our comprehensive summary.
Sources:
Eurocontrol: Aviation Intelligence Dashboard