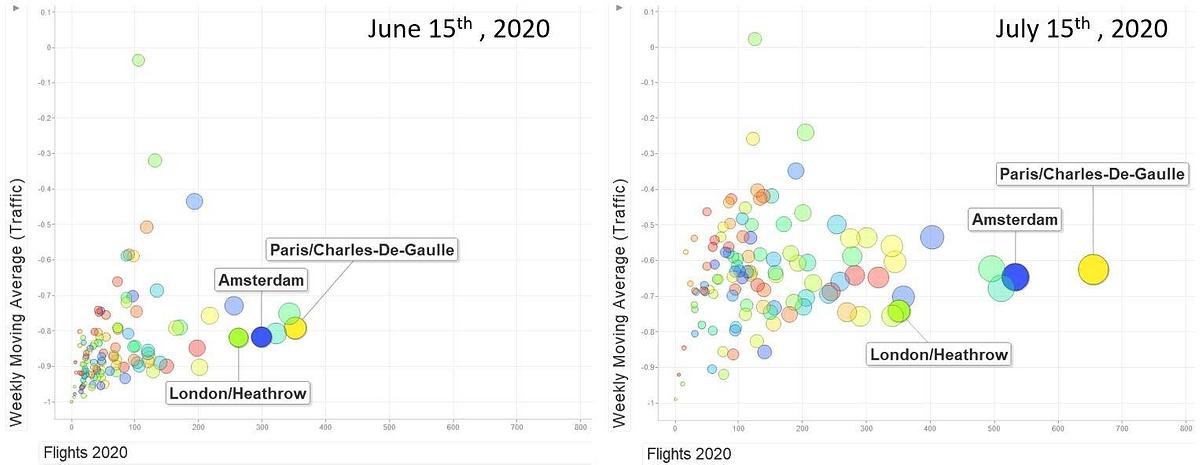
Several factors can be considered when determining why some players are better able to pick up air travel demand than others. For example, following the disruption of the European market, governments have taken a range of measures to contain the spread of the virus and support the sector. But measures vary per country, airport, and airline type. And pre-COVID-19 market characteristics should be taken into account as well. Here's an example: EUROCONTROL’s Aviation Intelligence Dashboard shows that London Heathrow (LHR) lags behind on other major European hubs such as Amsterdam Schiphol (AMS) and Paris Charles De Gaulle (CDG).
What are the consequences of these dynamics? That's a question I'll answer in this 2-part blog series. Today, let's have a look at 3 types of drivers for recovery that affect current market dynamics and allow some parties to better position themselves than others.
1. Country-specific characteristics
Key elements include travel restrictions imposed by governments and economic outlook. Countries that have taken relatively mild COVID-19 measures (those that have not imposed a travel ban or a mandatory 14-day self-quarantine), and are able to minimize the impact on spending power are winners with respect to international traveling.
2. Airport characteristics
Lockdown strategies are paramount: some airports have closed their doors while others continue to operate at a basic level. The extent to which an airport was congested before the outbreak is also important – some hubs are well positioned to pick up additional air travel that would have had to go through regional airports otherwise. Furthermore, the balance between long-haul (intercontinental) and short-haul (EU/domestic) flights plays a role, as long-haul flights are expected to resume later. Finally, we need to consider the respective percentages of cargo and passenger flights: the absence of long-haul PAX operations, paired with the need for medical supplies, has spiked demand for cargo.
The winners are major saturated airports – especially those in the vicinity of their regional counterparts – that have continued to operate at a basic level during the crisis. The share of long-haul travel will play a key factor in short- and medium-term recovery of the airport’s activities. Obviously, freight-oriented airports that carry out a large number of cargo flights also do well.
3. Airline characteristics
When it comes to airlines, we should have a look at business models. Are they low-cost carriers, large hub carriers, sub-scale national carriers, or regional carriers? The network, fleet composition, and number of base locations all impact the airline’s position to pick up demand. Last but not least, it's important to consider differences between financial support packages provided by governments and/or shareholders (loan size versus equity participation).
We've got two winners here. First, low-cost carriers that are able to respond quickly to market recovery, as it's easy for them to move fleet around within their own EU point-to-point network. Second, large hub carriers that have continued to operate at a basic level from saturated airports, have received support, and are based in well-positioned countries whose economies are less affected by the crisis. However, the larger the share of long-haul operations, the longer the recovery in terms of total traffic.
More on the 3 drivers for recovery
As we've discussed, several drivers for recovery allow some players to position themselves better than others. Curious to read specific cases? Keep an eye on our next blog!
Read our comprehensive summary.pdf if you want to know more about the drivers for recovery.

Figure 1: Airport activity at top-100 EU airports, showing airport activity (number of flights) as a percentage of activity on the same day last year.
Sources:
FD: “Bedrijven grijpen Corona aan om structureel minder te vliegen”
Eurocontrol: Aviation Intelligence Dashboard

